
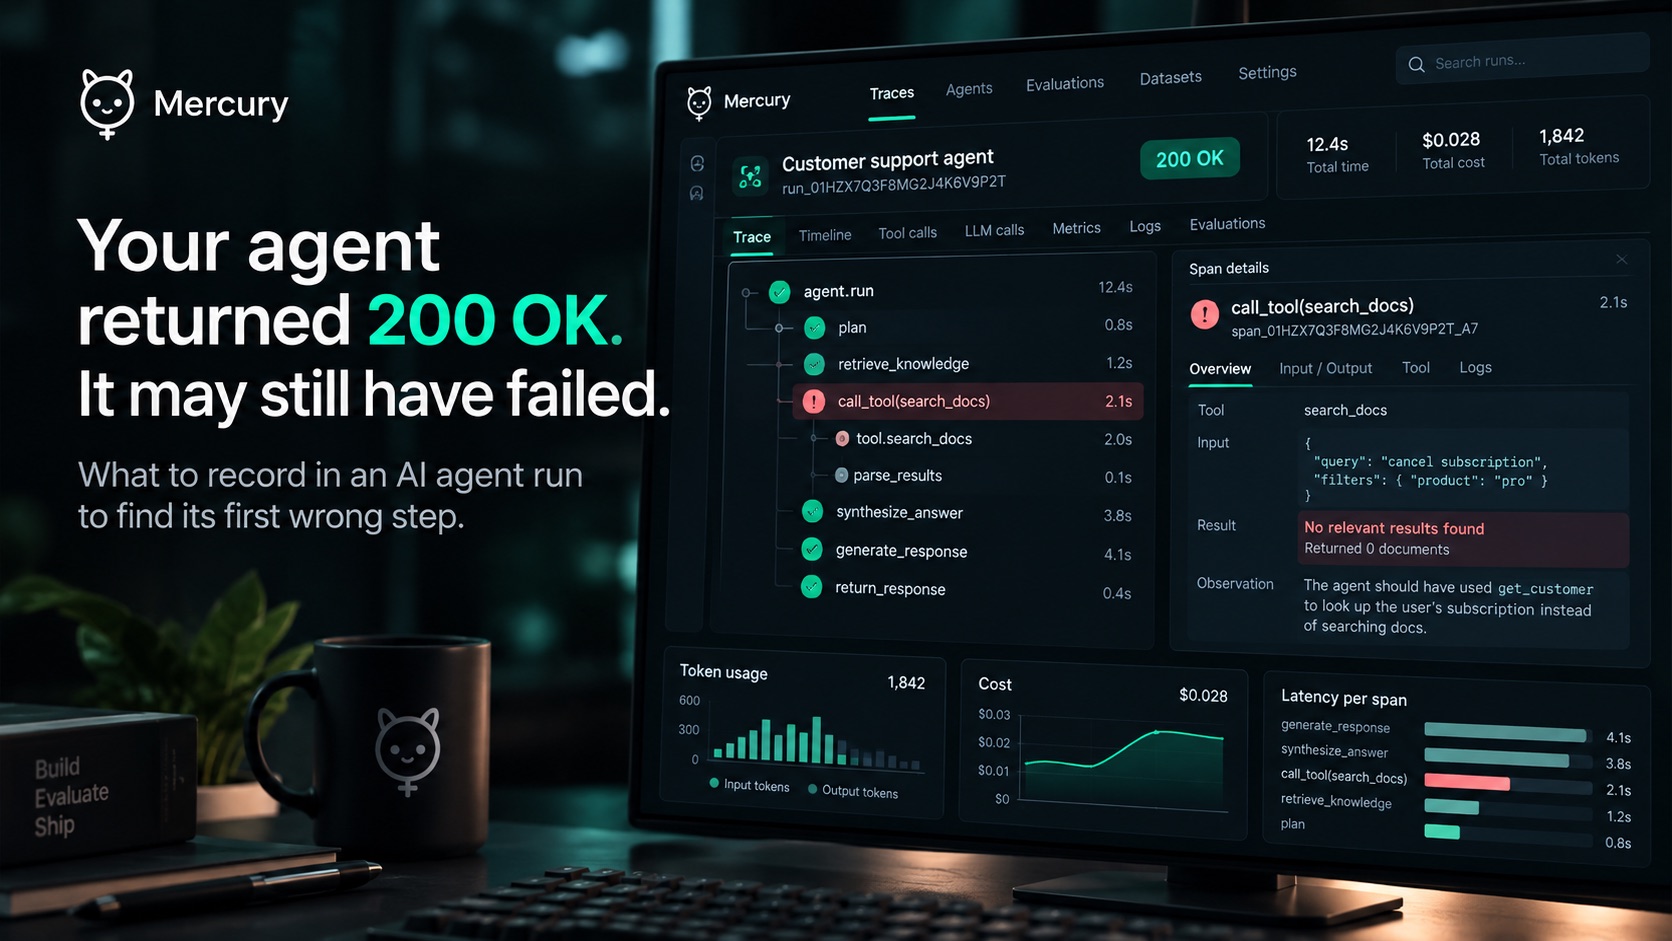
An agent can finish a run with a fluent, confident answer and still have done the wrong thing. It may have picked the wrong tool, pulled a stale fact into context, or called the same tool five times with the same arguments. Uptime and error logs won't show any of that. This post looks at what a run needs to record so that you can find the first step where it went wrong, and what Mercury records today.
Why normal monitoring misses agent failures
A normal service either fails or it doesn't. An agent can return a successful response and still fail the task. A 200 OK means the request was handled. It does not mean the task succeeded. Snowflake's agent evaluation guide puts the gap plainly: a correct final answer is only the last part of the run. It also separates two jobs. Evaluation measures quality against defined tasks. Monitoring watches live behaviour through traces, logs, latency, cost, tool failures and user feedback.
Microsoft's Foundry observability documentation describes tracing as capturing LLM calls, tool invocations, agent decisions and dependencies between services. New Relic's agent observability write-up makes the same point from the vendor side: without trace-level data, you can see that something went wrong but not why.
The unit of debugging is the first wrong step
The final output is the symptom. The cause is usually an early step: a tool chosen when another was needed, a retrieved document that was out of date, or an argument that looked reasonable and wasn't. By the time the answer is wrong, that step is several calls back.
In this post, the first wrong step means the earliest consequential deviation: the first step whose effect changed what came after it in a way that mattered to the outcome. A step that was odd but harmless does not count.
So the question for a trace is not "what did the agent do?" It is "where is the earliest consequential deviation, and what did the agent have in front of it at that point?" A trace that can't answer that will show you a long, plausible transcript and leave you to read all of it.
Here is a made-up run to show the difference. The user asks for last month's invoice total. Step 1 searches the wrong folder and gets a file from the previous year. Step 2 reads it, sums the totals, and reports a figure. Step 3 writes a fluent summary. The final answer looks right, and every tool call returned ok. A transcript shows three clean steps. A trace with timestamps, arguments and parent links shows that step 1 was the first consequential deviation, and that step 2 never had a chance to fix it. The run was never going to produce the right number, so the fix belongs at step 1, not in the summary.
This example is illustrative, not a recorded Mercury incident.
What a useful agent trace records
The clearest published model I found is OpenTelemetry's draft GenAI agent conventions. The v1.41.0 agent span spec defines operation names including invoke_agent, execute_tool, create_agent and invoke_workflow. The OpenTelemetry GenAI blog shows the resulting tree: an invoke_agent span with child spans for each model call and each tool call. It also records token counts such as gen_ai.usage.input_tokens and gen_ai.usage.output_tokens, plus finish reasons and latency histograms.
Mapped to the questions you need to answer:
| Question | What to record |
|---|---|
| Which tool was chosen? | The chosen tool, its arguments, and the tools available at that step |
| Did the call work? | The result, error type, latency, and whether the result entered subsequent context |
| Is it looping? | Repeated calls with the same arguments, or revisited goals |
| Where did work pass? | Handoffs to sub-agents, and what context went with them |
| What changed in context? | Items added, dropped or summarised between steps |
| What did it cost? | Token usage and money per model call, so a runaway loop shows up as a number |
| Where did it first go wrong? | Ordered steps with timestamps and parent links, so you can walk back from the bad output |
The last row is the one that matters most. Parent links and timestamps are what turn a transcript into something you can walk backwards through.
Three cautions
Traces show what happened, not whether it was right. You still need evaluations over whole runs. Snowflake notes that production traces are often the raw material for later evaluations, so the two work together.
Full content is useful and risky. Tool arguments and results can contain personal data, credentials or customer records. The OpenTelemetry GenAI blog notes that content capture is opt-in for this reason. Redaction and retention need an explicit design, not a default that someone forgets to change.
The standard is not final. The OpenTelemetry agent spans are marked as development status, and vendor dashboards may use different attribute names. Treat these conventions as the best current reference, not as settled.
What Mercury records today
We read the code paths in src/core/agent.ts, src/core/context-window.ts and src/utils/logger.ts at commit c969d77 on main. We did not run a live session, so the findings below are from code review.
It helps to separate two kinds of observability. Live observability is what you can see while a run is happening. Persisted observability is what survives the run, so you can debug it afterwards. Mercury has some of the first and, from what we found, very little of the second.
Live observability:
- Live tool events. Each tool start and finish is pushed to the interface with its duration. We did not find a persistent record of these events.
- A per-turn usage log. At the end of a turn, Mercury logs the provider, model, input, cached and output tokens, step count, tool-call count and elapsed time. The logger is pino, and its level is
silentunless you run with--verboseor setLOG_LEVEL.
Persisted observability:
- A turn-end tool trace. Each tool call becomes one line: the tool name, one summarised argument capped at 80 characters, and an outcome such as
ok (12 lines)or an error message. These lines are written into the session so the next turn can see them. The trace is capped by line count. We did not find the per-turn usage log kept anywhere by default. - Redaction of errors. Errors pass through a
redactDeephelper before they are logged, so keys in provider errors are masked.
Measured against the table above, we did not find the following:
- Call IDs, timestamps, durations or step indexes in the stored trace. You can read the order, but not the timing.
- A record of the tools available at each step.
- A parent link from a delegated task to the work it produced.
- Per-model-call token usage or cost. Usage is recorded per turn.
- A record of context changes, such as compaction and tool-result summarising. These appear to happen in memory.
- Full arguments. The stored trace caps them at 80 characters, so you often can't reconstruct exactly what was sent.
- An OpenTelemetry dependency in
package.json, or an audit log.
So the honest version is this. From the code we read, Mercury can show roughly what it did in the last turn. We did not find a way to show the first wrong step of a bad run from what it stores. This is the same gap our October 17 permissions post described from the other side: we can't audit access we don't record.
What we would instrument first
The smallest change that closes the biggest gap is to give every tool call a stable ID, a start time, a duration and a parent turn ID, and to write those to the session store instead of only the summary line. That alone lets you order a run, time it, and link each call to the turn that made it. Per-model-call token usage comes next, then content capture behind an explicit, off-by-default setting with redaction.
We have not built this yet. It is a plan, not a shipped feature.
What it means for you
If you run agents in production, check three things before you need them. Can you tell which tool call came first in a bad run? Can you see how long each call took? Can you see what a single run cost, call by call? If the answer to any of these is no, that is a gap to close before the next failure.
If you cannot reconstruct the run after it fails, a successful response can hide more than it proves.